Abstrict
Pakistan's pharmaceutical sector, pivotal for GDP, employment, and poverty reduction, comprises 759 companies in dynamic growth. We employ Data Envelopment Analysis (DEA) to identify efficient firms in 2017-2018, showcasing DEA's superiority. Evaluating ten industry leaders, e.g., Merk, Abbott, and GSK, we assess variables like Assets, Liabilities, Sales, EPS, DPS, and ROE. High Noon excels in consistent efficiency, while others improved from 2017 inefficiencies. Sanofi, despite revenue, underutilized EPS, DPS, and ROE. The study emphasizes companies' global and national standings, offering revenue and resource optimization insights, and enhancing industry efficiency. Implementing suggestions aids firms and Pakistan's GDP, advancing the pharmaceutical sector. Valuable for international stakeholders to invest in Pakistan's pharmaceutical progress.
Keywords
Pharmaceutical Companies, DEA Methodology, Total Assets, Liabilities, Equity, Salaries, Wages, and other benefits, Sales, Earning Per Share (EPS)
Introduction
A pharmaceutical company is a commercial company licensed to conduct research, development, marketing, or distribution of the most common drugs in the healthcare field. These companies are subject to various laws and regulations regarding patents, testing, and marketing of medicines (especially prescription drugs). Pharmaceutical companies discover, develop, and manufacture drugs through public and private organizations that sell, distribute, import, or sell their drugs in the market. (Fine et al., 2000).
The pharmaceutical sector in Pakistan is very dynamic and reforming. Around 759 pharmaceutical companies are operating in Pakistan, among them twenty-five pharmaceutical firms are operated by multinational companies. Pakistan’s pharmaceutical sector covers approximately 70% demands of the country for medicines. As far as the stock market is concerned, the local pharmaceutical market is divided equally among the national and multinational firms (Junaidi, 2015).
In the past ten years, the national pharmaceutical sector had shown tremendous growth. In the past few years, the pharmaceutical industry has invested heavily in self-upgrading, and now, most industries follow the good manufacturing practices of domestic and international guidelines. Currently, pharmaceutical firms can produce a variety of products, from simple pills to complex biotechnology and value-added general-purpose compounds (Haq, 2014).
Table 1
Numbers of Pharmaceutical Companies in Pakistan
|
Years |
Number of Pharmaceutical Companies |
|
1999 |
304 |
|
2007 |
406 |
|
2017 |
759 |
Source:
(Intercontinental medical statistics)
Table 1 indicates, 304 pharmaceutical companies were
operating in 1999. In the past 9 years, the number of pharmaceutical companies
has increased from 304 to 406. The table shows that the number of
pharmaceutical companies in 2017 was 759.
Table 2
Number of pharmaceutical companies in divisions
|
Areas |
1999. |
2017 |
|
Sindh |
101 |
183 |
|
Punjab |
160 |
404 |
|
Khyber Pakhtunkhwa |
32 |
114 |
|
Baluchistan |
2 |
15 |
|
AJK |
9 |
7 |
|
Total |
304 |
759 |
Source:
(Intercontinental medical statistics)
Pharmaceutical firms are working all over Pakistan.
Pharmaceutical manufacturing plants
are often concentrated in
main cities such as Peshawar, Lahore and Karachi. Although these figures
reflect that most companies
are located in Punjab, Sindh is a leader in pharmaceutical companies in terms of
manufacturing, utilization of resources, and business scale. According to
experts, the most important factor driving sales is income growth over a
period, which is shown in the per capita income growth. The increase in per
capita income has in turn provided people with better medicines and medical facilities
(PPMA, 2017).
Impact of Pharmaceutical Companies on the Economy
Pharmaceutical companies contribute a remarkable amount to the gross domestic product (GDP) as indicated by a survey of healthcare. This sector imparts 1.6 billion US dollars to the Gross Domestic Product (GDP). Due to its impressive involvement in the Gross Domestic Product (GDP), the government has invested significant effort towards the development of the pharmaceutical industry. For the manufacturing of medicines, Pakistan is considered as 8th biggest manufacturer of pharmaceuticals in the world.
The pharmaceutical sector of Pakistan is developing exceptionally. No matter in any country, the backbone of public health is the pharmaceutical sector whether it is a developed country or a developing country. Pharmaceutical preparations are the basic component of the medical service framework, as well as the best compensation for society and individuals. Pharmaceutical companies generate employment and reduce poverty by empowering the citizen and increasing their access to necessities of life. Pharmaceutical companies help in wealth creation. Pharmaceutical companies engage investments on a large scale from stakeholders and corporations. The pharmaceutical industry promotes research and development (RandD) by creating highly skilled jobs and increasing scientific knowledge. It helps in extending business ethics and social responsibility to the nation by making donations, awareness, and a wide array of capacity-building interventions that have strengthened healthcare institutions (Khan, 2016).
As we know that Pakistan has more than 700 pharmaceutical companies. In this study, we will focus to measure the efficiency of pharmaceutical companies operating in Pakistan and we will rank these companies according to their performance. To conduct this study, 10 leading pharmaceutical companies are Merk Pharmaceutical, Abbot Laboratories, Glaxo Smith Kline (GSK), AGP Pharmaceuticals, Novartis Pharmaceutical, Macter Pharmaceuticals, Sanofi, ICI Pharmaceutical, High Noon Pharmaceuticals, and Eli Lilly have been selected as a sample. A brief introduction to these pharmaceutical companies is presented in a subsequent section.
Introduction of Companies
Merck Pharmaceutical
Merck is a German organization, which was founded by the Merck family in 1668 when Friedrich Jacob Merck (a German pharmacist) bought a medical store in Darmstadt. In the nineteenth century, the Merck company evolved from a drug store to a significant pharmaceutical company and presented the business assembling of morphine (Voinea, 2017). Merck Pharmaceutical is a multinational organization. It has a volume of $39.7 billion and globally, it took a spot as the top fifth pharmaceutical organization in 2018. Merck Pharma has been operating in Pakistan for 40 years. Its manufacturing plant is in Quetta and the head office is based in Karachi. Its distribution centre is based in Lahore. The production facility in Quetta is associated with the manufacturing and packing of solids (tablets and capsules), fluids (syrups), injectables (ampoules), and ointments. this company has three major segments to target market segments are cardiometabolic care and oncology, nutrition and infection, and fertility and neuro care (Hayat, 2012).
ABBOT laboratories
Abbott Laboratories is an American international health device and health care organization associated with headquarters in Abbott Park, US. The organization was founded in 1888 by ‘’Dr. Wallace Calvin Abbott’’. Today, it sells clinical equipment, branded generic drugs, and nutritional products (ABBV, 2013). Abbott started its operations in Pakistan and got a marketing affiliation in 1948. This organization had a consistent coverage that comprises a workforce of over 1500 employees. Now two manufacturing plants are in Karachi and produce pharmaceutical products.
Glaxo Smith Kline (GSK)
GlaxoSmithKline (GSK) is a British worldwide drug organization settled in Brentford, England (Forbes, 2017). GSK was founded in 2000, by the consolidation of Glaxo Wellcome and SmithKline Beecham. GSK was the world's 6th biggest drug organization. GSK started its operation in Pakistan on January 1st, 2002 and now it is standing as the largest pharmaceutical company in Pakistan by capturing 57.66 billion market shares.
AGP Pharmaceuticals
AGP started its business tasks in 1989 as a free drug-producing organization in Karachi, Pakistan. It is consistently developed through assembling and promoting items under authorizing courses of action with numerous organizations worldwide. Furthermore, through assembling and advertising its brands. AGP introduced “MY-Hep” for Hepacivirus in 2016. Further, the Drug Administration of Pakistan approved the prices of malignant tumour treatment drugs, which can provide a moderate alternative treatment for other diseases and has become prescription drug for considering the high incidence of breast cancer in Pakistan (AGP).
Highnoon Laboratories
Highnoon Laboratories were founded in 1984 and it was listed as a private limited company in 1995. Its head office is located in Lahore. Highnoon captured the cardio, gastro, and diabetic segment and retain its profits through these segments (Highnoon).
ICI Pharmaceutical
ICI is renowned as a prominent chemical company in Pakistan and was established back in 1944. Situated in Karachi, it proudly serves as a manufacturer of pharmaceutical products, soda ash, and agriculture compounds. ICI Pakistan holds a distinguished position as one of the major quoted companies on the Pakistan Stock Exchange, boasting a substantial paid-up share capital of Rs 1.39 billion. With a workforce comprising around 1,295 dedicated permanent employees, the company also avails services from a similar number of individuals through contractual arrangements (ICI).
Macter Pharmaceuticals
Macter International Limited is among the most Pharmaceutical organizations in Pakistan. Macter is a public limited organization and has a remarkable 30-year history in the production of medicine formulations. The vital action of the organization is to create and market drug items. The organization appreciates a true standing of import and is among the most 5 producers by volume. Macter has a solid corporate administration structure and frameworks. Macter International Limited was founded in Pakistan in 1992 as a private limited organization and was changed over into a public limited organization in 2011. The central action of the organization is to make and market drug items (Macter).
Eli Lilly Pharmaceuticals
Eli Lilly is an American drug organization settled in Indiana-polis, with workplaces in 18 countries. Its products are sold in around 125 countries. The organization was established in 1876. This organization was founded by an American chemist ''Col Eli Lily''. Eli Lilly Pakistan (Pvt) Ltd. is recorded in Pharmaceutical Companies and is situated in Karachi Pakistan. It is operating in Pakistan for several years (Blake, 2013).
Operational Definition of Variables
The variables used in the present study are defined as follows:
Assets
An object or possession that an individual or organization asserts ownership over is considered valuable and available to fulfil responsibilities. These valuable possessions, referred to as "assets," encompass future economic benefits that the entity gains control of as a result of past transactions or events (Board, 1992). In the realm of financial accounting, an asset is defined as any resource owned or managed by a business or economic entity, regardless of whether it is tangible or intangible. Assets hold the potential to generate positive economic value, and they epitomize the worth of ownership, which can be converted into cash (even though cash itself is also classified as an asset) (Yesyurun, 2021).
Liabilities
A thing for which someone is responsible, especially the amount of money owed is called Liabilities. Liabilities are defined as legal and financial debts or obligations incurred by the company during its operations.
In financial accounting, liabilities are defined as future sacrifices of economic benefits that the entity is obligated to make to other entities due to past transactions or other past events, and these settlements or settlements may lead to the transfer or use of assets. Provide services or otherwise generate economic benefits (Board, 1992).
Equity
Equity refers to the amount of capital contributed by the owners or the difference between an organization's total assets and its total liabilities. "Equity" is the residual interest in the assets of the entity after the deduction of its liabilities (Board, 1992).
Taxation
Taxation is the fundamental process through which the government gathers funds from its citizens to finance the provision of public services and meet various governmental expenses. It entails mandatory financial contributions or levies imposed by government bodies on taxpayers, whether they are individuals or legal entities (Cung, 2020). These collected funds play a crucial role in funding government initiatives and public expenditures, ensuring the smooth functioning of essential services and infrastructure for the welfare of society.
Salaries, Wages and Other Benefits
Salary is the remuneration that should or should be paid to employees for the work or services performed on behalf of the employer. Wages are usually paid directly to employees in the form of cash or cash equivalents, such as by cheque or directly deposited into the employee's bank account or an account designated by the employee. In addition, various other methods can be used to pay all or part of the expenses, such as payment in kind in the form of goods or services provided to employees (Kumah, 2017).
Sales
Sales are activities related to sales or the number of goods or services sold within a given target period.
Earnings per Share (EPS)
Earnings per share (EPS) is a crucial metric used to assess the profitability of a listed company on a quarterly or yearly basis. It represents the amount of profit earned for each outstanding share of the company's stock. In line with the International Financial Reporting Standards (IFRS), diluted earnings per share are computed by making adjustments to both earnings and the number of shares outstanding, considering the potential impact of diluted options and other potentially diluted common stocks (33, 2008; IAS33, 2008). This approach provides a more comprehensive and conservative view of the company's earnings potential, taking into account the potential dilution effects of convertible securities or other financial instruments that could potentially increase the number of outstanding shares in the future.
Dividend per share
The dividend per share is the sum of the declared dividends issued by the company for each common share issued.
Return on Equity
Return on Equity (ROE) serves as a pivotal metric to gauge a company's profitability by determining how much profit it generates per dollar of shareholder equity. This measure is particularly valuable when comparing the performance of companies within the same industry. Similar to Return on Capital, ROE assesses management's efficiency in generating income from the equity available. A healthy ROE typically falls within the range of 15% to 20%. It plays a significant role in stock valuation alongside other financial ratios. While a higher ROE might suggest a higher stock price, predicting a company's stock value solely based on its ROE is not straightforward, as numerous other factors come into play (FORBES, 2013).
Literature Review
Muratoglu, G. (2017) investigated the connection between pharmaceutical industry exports and the gross domestic product (GDP) of twenty-seven countries over the period from 2000 to 2014. This study applied the Comparative Advantage Index and the regression model. The outcome shows that capital stock and total factor productivity factors are significant and had positive signs towards GDP. The results depicted that pharmaceutical trade exports had a positive impact on GDP per capita income.
Majumdar, S. (2017) studied the impact of the financial crisis recovery and used the non-parametric Malmquist Productivity Index from 2007 to 2014 to decompose changes in profitability into changes in technical efficiency and innovation. The Malmquist investigation indicated that the most productive enterprises were food and snacks, media communications, and pharmaceutical products. This study used the data envelopment analysis (DEA) with the Malmquist productivity index. The results of this study show that seventeen out of twenty-seven organizations had innovative improvements through investments in framework, an extension of capacity, adoption of new technologies, as well as innovative work.
The result shows that five out of twenty-seven organizations specialized in a change in efficiency because there had been investments and support by the government. Although these organizations showed the absence of an appropriate equilibrium of the new inputs versus outputs. Kamath, G. B. (2008) found the relationship between intellectual capital (IC) and physical capital to measure the performance of companies by evaluating production, market value, and profitability. For this study, twenty-five pharmaceutical firms were selected and ranked by using the value-added intellectual coefficient index (VAIC). For the analysis of correlation, this study applied the regression model. The author concluded that IC had vital impacts on the physical capital of the companies during the study.
Acemoglu and Johnson (2007) explored the impact of general medical issues and proxies by life expectancy at birth on economic growth and exploit the huge upgrades in life expectancy driven by worldwide mediations. This was an empirical analysis and used a regression model. The outcomes of this study show that the expansion in life expectancy signi?cantly increased the population; birth rates did not decay sufficiently to make up for the expansion in life expectancy. This study shows a positive outcome of life expectancy on total GDP over the ?rst forty years, and this impact becomes lesser to some degree throughout the following twenty years, yet it was insufficient to make up for the expansion in population.
Mehralian, et.al. (2012) explored the connection between human capital and actual capital (pro?tability, efficiency, and market valuation) with the conventional measures of performance of the organization inside the pharmaceutical industry in Iran. They collected data from pharmaceutical organizations that were recorded in the Iranian stock exchange during the period from 2004 to 2009. For correlation investigation, this study applied a regression model. This study shows the connections between the performance of an organization's IC and customary execution markers are shifted. The ?ndings proposed that the exhibition of an organization's IC could clarify higher return on investment, however, it showed zero efficiencies in market value in Iran. Similarly, the investigation found that during the study period, actual capital was considered to have a significant impact on the company's profitability. Regression analysis found that structural capital has nothing to do with financial performance. The lack of relevance to market valuation shows that Iranian investors do not pay attention to structural capital when assessing the value of an organization.
Muaratouglu, G. (2016) investigated the provocations of export competitiveness within the manufacturing industries of twelve countries in the Organization for Economic Cooperation and Development (OECD) from 1999 to 2010. In this study, the Root Cause Analysis (RCA) index for manufacturers’ exports was calculated. In this study, the panel data analysis was utilized for checking the effects of actual capital, cost of labour, framework, research and development, the shares of innovative export, and foreign direct investment fluctuations on the trade of producers. This study applied static panel data analysis and applied both a fixed effects model and a random effects model. The results show that customary factors, actual capital, and labour costs usually discover the export competitiveness of manufacturers in OECD countries. In addition, between 1999 and 2011 foreign direct investment in manufacturing regions did not contribute fairly to the export competitiveness of OECD countries.
Hess and Rothaermel (2011) suggested that resource combinations that emphasize similar parts of the value chain were substituted because of information redundancies. This study examines simultaneous purchasing as an alternative towards the traditional division of manufacturing and purchasing limit decisions. The study collected yearly data from 108 companies for the thirty years from 1974 to 2003. This study was conducted through a regression methodology. The results of this investigation were seeming to be positive yet lessening the impact of downstream alliances and star scientists.
Blanc, L. (2015) wanted to find the factors that drive European Union (EU) pharmaceutical exports. This examination reveals insight into the unpredictable connection of factors affecting the EU export of pharmaceuticals. This study investigated that the IP's protection in the recipient country, the size of its economy, the importance of its health sector, and the quality of its infrastructure were important driving forces for driving EU pharmaceutical exports. This study applied the Gravity Model and applied regression methodology. The first regression result of their research shows that health expenditure and inland regions have a statistically significant impact on EU drug exports, and port containers are also statistically significant. The results show that the degree of IP in the receiving country has a positive impact on EU exports.
In a study by Kirim, A. S. (1985), the validity of challenging arguments related to the impact of licensing on the economic development of less developed countries and the impact of the cancellation of patents in one of the world’s twenty largest markets on the development of the Turkish pharmaceutical industry were reviewed. This study applied an overpricing strategy. This study shows that based on evidence from the Turkish pharmaceutical industry, only one patent has no obvious causal relationship with the industrial development of underdeveloped countries. Hickson, K. (2014) proposed methods that were used for calculating the improved value of mortality and morbidity. The study was conducted through a willingness to pay for mortality improvements. The results of this inspection show that those who are excited about understanding financial government upgrades need to consider broadly improving their health. The results of this study show that the value of statistical life is greater than the value of statistically healthy life years and that most of the mortality trends in the 20th century are positive.
The Akhtar, G. (2013) review found that the pharmaceutical industry has contributed to human well-being through job creation, supply chain and community development, and provided significant socio-economic benefits to society. The industry also plays an important role in technological innovation, which can reduce the cost of economic activities elsewhere in the Indian economy. This study applied the Regression methodology. The results were the positive effects of pharmaceutical companies on the development of the economy of India.
Bloom, et.al. (2004) investigated a production work model of total monetary development including two factors that macroeconomists had identi?ed as central segments of health status, actual capital, and labour experiences. The purpose of this investigation was to include health for a well speci?ed total creation work trying to check the presence of health impacts towards work profitability and quantify its quality. This study applied a regression methodology. The results of this study show that if they control their knowledge of the labour force, fitness will have a favourable and considerable impact on total output and is in fact important. The results of this study show that the average experience is favourable with the average experience squared. The outcome shows that health had a favourable and factually considerable impact on economic development.
Barro, R. J. (2013) focused on productivity advances that come from innovative advancement and expanded actual capital in the form of schooling. The fundamental purpose behind this examination is to apply the soul and device of the ongoing advances in growth theory to the interaction between health and growth. This study applied the regression methodology. The outcomes show a signi?cantly positive effect on growth from the long periods of schooling at the secondary and higher level for males age twenty-five and over. The outcomes did propose that an exogenous drop in birth rates raised the growth rate of per capita income.
Danzon, P. M. (1997) examined the welfare effects of price discrimination, both between health plans within the United States and cross-nationally between countries. Drug research and development is the cost of international services for patients worldwide, and the research and development cost of new drugs largely depends on the number of consumers or countries/regions that are ultimately served. This article incorporates research and development into the welfare analysis of price separation. There was a difference between the pharmaceutical market and the regulated monopoly that usually uses Ramsey pricing. The analysis here shows that the actual difference should be similar to the Ramsey optimal difference to the extent that the actual price difference reflects the difference in the elasticity of buyer demand in industries with competitive entry. Similarly, there are strong welfare reasons for maintaining price differences between countries, and parallel trade and regulation based on foreign prices are destroying these differences.
The evidence showed that segmentation of the market commands pharmaceutical manufacturers to adopt uniform prices, and manufacturers did not adopt profit-maximizing prices. Danzon and Chao (2000) reported lists of manufacturer-level medication costs for 6 countries: Canada, France, Germany, Italy, Japan, and the UK, which were compared to the costs in the United States. This study utilized more comprehensive data and proper strategies than those utilized in past studies. This study evaluated the value difference sensitive to the index measure utilized and analyzed the components characteristic in index measures that raise the assorted appraisals. This study applied the regression methodology. An important finding from this analysis was that any generalization about relative prices for drugs in several countries was tentative at best thanks to the variety of products, prices, and volumes, which makes conclusions very sensitive to the sample and methods. If different countries apply external referencing to identical products but used different benchmark countries or different weights, then each country’s perspective on the identical distribution of relative prices will yield a distinct conclusion about their relative indicator.
During this study, the worth was anticipated to be more negatively related to generic competitors than to therapeutic competitors because generics were closer substitutes and pharmacists had strong incentives to be price-sensitive in regimes that allow the generic substitution. For the checking of the first-mover advantage, they included the lag in months between this molecule launch date and thus the launch of the first molecule within the ATC3 molecule entry lag. The expected sign was negative if first-mover advantage dominates product improvements which can be embodied in later molecules. Danzon, et.al (2015) investigated determinants of the ex-producer price for the originator and standard medications across countries. The primary focus of this study was medications to treat HIV/AIDS, TB, and malaria fever in middle- and less-developed countries and it examined the results of per capita income, income dispersion, competition from the originator and generic substitutes either the drugs were sold to retail pharmacy stores or tender procurement by non-government organizations.
This study reports regression estimation. The empirical analysis uses data from IMS (Intercontinental Medical Statistics) Health on ex-manufacturer prices to retail pharmacies for the originator and generic drugs in two large therapeutic categories (cardiovascular and anti-infectives) in thirty-seven countries that include both high- and low-income countries. This study assessed the quasi-difference in the differences model of log prices with factors to check for different effects for each license channel category (retail generics, procurement originators, and obtainment generics). Standard competition models show that the costs were expected to be inversely associated with the number of competitors.
Research Methodology
We have obtained quantitative data. Quantitative data is defined as data esteems as checks or numbers, where every data set has a novel worth related to it. This data is any quantifiable information that can be utilized for numerical figuring’s and factual examination, so reasonable choices can be made dependent on these numerical determinations.
DEA Methodology
DEA (Data Envelopment Analysis) is considered a powerful method in the literature. Compared with traditional econometric methods such as simple ratio and regression analysis, its performance measurement activities are more reasonable (Shewell et al., 2016).
Data Envelopment Analysis (DEA) is a mathematical approach that utilizes linear programming techniques to transform inputs into outputs, with the goal of comparing the overall performance of similar companies and products. In DEA, all Decision-Making Units (DMUs) are assessed by selecting a combination of inputs and outputs that maximizes their relative performance. The relative performance, denoted as "or," is the performance rating assigned to each DMU based on DEA calculations. This rating represents the ratio of the total weighted output to the total weighted input.
DEA employs linear programming to estimate relative performance, which is a non-negative value calculated based on linear relationships between the inputs and outputs of the DMUs under analysis. In essence, DEA determines how efficiently a DMU can produce a certain level of output relative to the amount of input it utilizes, in comparison to other similar DMUs.
DEA is a relatively novel data-driven method used to evaluate the performance of various peer objects called DMUs that convert multiple inputs into multiple outputs. The definition of a DMU is broad and flexible, allowing for its application in various contexts, across different industries and regions worldwide. Over the recent decades, DEA has been widely employed to assess the performance of objects such as hospitals, universities, energy companies, cities, commercial enterprises, and even entire states or regions.
The advantage of using DEA lies in its simplicity, making it applicable in situations where other methods might face challenges due to the complex nature of the relationships between multiple inputs and outputs across different DMUs (Mardani et al., 2017).
Variables used in the Study
This study used secondary data from annual reports of pharmaceutical companies operating in Pakistan and took the variables to measure the efficiency of the companies by comparison of their input and output variables. Input variables (total assets, liabilities, equity, taxation, Salaries, wages, and other benefits) and output variables (Sales, EPS, DPS, and ROE) to measure the performance of the companies.
Variables
o Total Assets (Input)
o Total Liabilities (Input)
o Total Equity (Input)
o Taxation (Input)
o Salaries, Wages and other benefits (Input)
o Total Sales (Output)
o Earnings Per Share (EPS) (Output)
o Dividend Per Share (DPS) (Output)
o Return on Equity (ROE) (Output)
Data Collection Procedure
The data is collected through the use of auxiliary sources. The principal data is collected from audited annual reports issued by pharmaceutical companies in Pakistan. We picked up two-year data from 2017 and 2018 because the data from the study was only available in these few years. The annual report is collected from the company website. The references are given in the table from which we collected our all data, and we collect Quantitative Data.
Data Analysis
The data for this study were all analyzed using Data Envelopment Analysis (DEA) method. Data for 2017 and 2018 were analyzed separately. Efficiency was computed for four output variables revenue, earnings per share, dividend per share, and returns on equity. Five input variables were used for the analysis, which are: total assets, total liabilities, total equity, taxation, and wages. In the course of the estimation, efficiency scores that were greater than 1, were converted by taking its inverse value. This is to ensure that the values of the efficiency scores align with the theory, wherein they should lie between 0 and 1. The results were extracted and are presented in tables 1.1 to 1.4 Also, the results are further analyzed using graphical analysis.
Results
Analysis of DEA Models
The results were extracted and are presented in tables 1.1 to 1.4 Also, the results are further analyzed using graphical analysis.
Table
3
DEA Results
for Revenue as Output
|
Firms |
2017 |
2018 |
||
|
Rank |
Theta |
Rank |
Theta |
|
|
Merck |
4 |
0.075938 |
1 |
1 |
|
Abbot |
8 |
0.011884 |
1 |
1 |
|
GSK |
6 |
0.014818 |
1 |
1 |
|
AGP |
2 |
0.126471 |
1 |
1 |
|
Novartis |
3 |
0.088858 |
1 |
1 |
|
MACTER |
9 |
0.003564 |
1 |
1 |
|
SANOFI |
7 |
0.013087 |
10 |
0.14 |
|
ICI |
5 |
0.048191 |
1 |
1 |
|
HIGHNOON |
1 |
1 |
1 |
1 |
|
Lilly |
10 |
0.00069 |
1 |
1 |
Table 3 shows that in 2017, only one firm was
efficient while maximizing revenue. This is Highnoon. In 2018, Highnoon maintained its efficiency in maximizing revenue,
showing the firm’s strong managerial commitment
towards efficient utilization of resources. Also, in 2018, Merck, Abbot, GSK,
AGP, Novartis and Macter, ICI, and Lilly improved on their revenue maximization
efficiency; implying that nine of the firms were efficient in 2018 while
maximizing their revenue.
Table
4
DEA Results
for Earnings per Share as Output
|
|
2017 |
2018 |
||
|
Rank |
Theta |
Rank |
Theta |
|
|
Merck |
1 |
1 |
1 |
1 |
|
Abbot |
1 |
1 |
1 |
1 |
|
GSK |
1 |
1 |
1 |
1 |
|
AGP |
1 |
1 |
1 |
1 |
|
Novartis |
1 |
1 |
1 |
1 |
|
MACTER |
1 |
1 |
1 |
1 |
|
SANOFI |
10 |
0.02 |
10 |
0.08 |
|
ICI |
1 |
1 |
1 |
1 |
|
HIGHNOON |
1 |
1 |
1 |
1 |
|
Lilly |
1 |
1 |
1 |
1 |
Table 4 reveals
that while maximizing earnings per share of shareholders, nine of the firms were efficient both in 2017 and 2018.
These are Merck, Abbot, GSK, AGP, Novartis, Macter, ICI, Highnoon, and Lilly.
Sanofi was not efficient in both years while trying to maximize its earnings
per share.
Table
5
DEA Results for
Dividend per Share as Output
|
Firms |
2017 |
2018 |
||
|
Rank |
Theta |
|
Rank |
|
|
Merck |
4 |
0.182251 |
1 |
1 |
|
Abbot |
7 |
0.005942 |
1 |
1 |
|
GSK |
6 |
0.012701 |
1 |
1 |
|
AGP |
5 |
0.113244 |
1 |
1 |
|
Novartis |
3 |
0.182942 |
1 |
1 |
|
MACTER |
8 |
0.003354 |
1 |
1 |
|
SANOFI |
9 |
0.000582 |
10 |
0.11 |
|
ICI |
1 |
1 |
1 |
1 |
|
HIGHNOON |
1 |
1 |
1 |
1 |
|
Lilly |
10 |
0.000224 |
1 |
1 |
In Table 5 there is evidence ICI and Highnoon were
efficient in 2017 while trying to maximize their dividend per share. Eight
firms were not efficient during this period. In 2018, many of the firms improved
their dividend per share maximization efficiency, as seven more firms improved
their efficiency. Along with ICI and Highnoon firms that maintained their
efficient operations in 2018, Merck, Abbot, GSK, AGP, Novartis, Macter and
Lilly firms improve their efficiency in 2018.
Table
6
DEA Results
for Return on Equity
|
Firms |
2017 |
2018 |
||
|
Rank |
Theta |
|
Rank |
|
|
Merck |
1 |
1 |
1 |
1 |
|
Abbot |
1 |
1 |
1 |
1 |
|
GSK |
1 |
1 |
1 |
1 |
|
AGP |
1 |
1 |
1 |
1 |
|
Novartis |
1 |
1 |
1 |
1 |
|
MACTER |
1 |
1 |
1 |
1 |
|
SANOFI |
10 |
0.22 |
10 |
0.41 |
|
ICI |
1 |
1 |
1 |
1 |
|
HIGHNOON |
1 |
1 |
1 |
1 |
|
Lilly |
1 |
1 |
1 |
1 |
Table 6 shows that nine of the firms were efficient
in maximizing returns on equity in 2017. These are Merck, Abbot, GSK, AGP, Novartis, Macter,
ICI, Highnoon, and Lilly. Likewise, these nine firms sustained their
efficient operations in maximizing their returns on equity. Further results from the table show that
Sanofi was not efficient during the years.
Graphical Analysis
Figure 1
Revenue Efficiency among Ten Manufacturing Firms
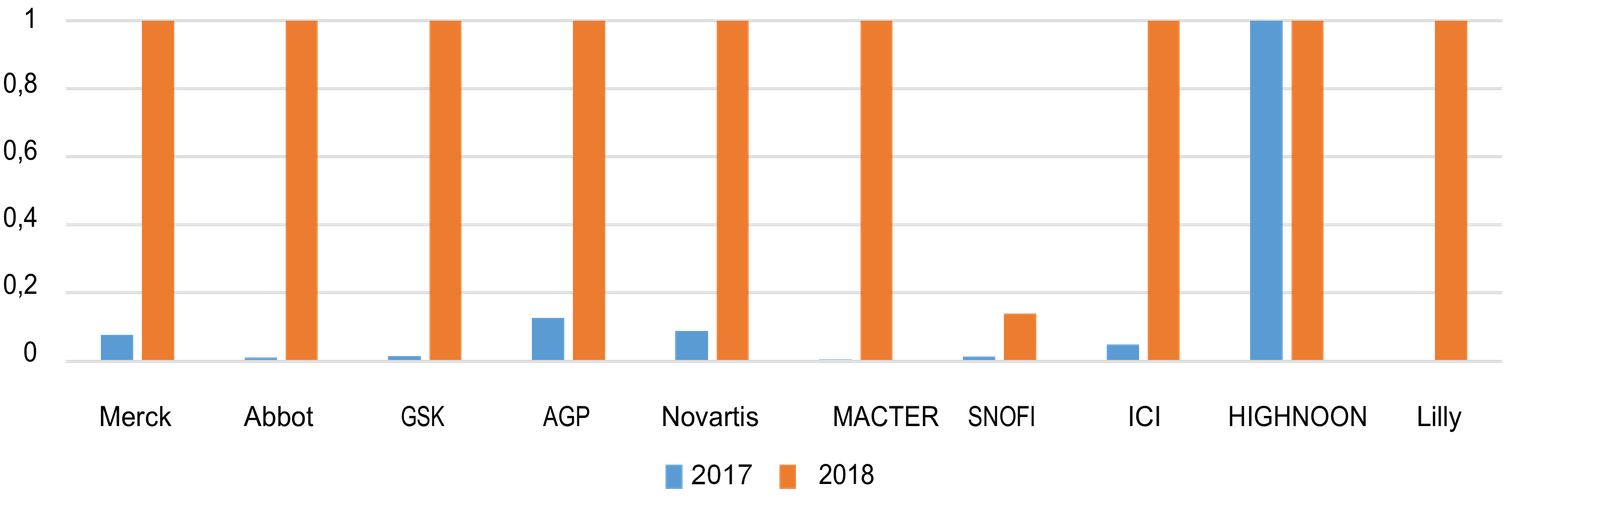
Figure 1
Figure 1 presents a graphical illustration of the efficiency of the firms in trying to maximize the revenue during periods of 2017 and 2018. The diagram shows that eight of the manufacturing firms significantly improved their revenue maximization efficiency between 2017 and 2018. These are Merck, Abbot, GSK, AGP, Novartis, Macter, ICI, and Lily. These firms had poor revenue maximization that was lower than 50% in 2017, which was improved to 100% in 2018. Highnoonfirm however, was efficient both in 2017 and 2018, indicating that the firm did not lose its efficient operations while maximizing revenue.
Figure 2
Earnings per Share Efficiency among Ten Manufacturing Firms
Figure 2 reveals that nine of the manufacturing firms were just efficient both in 2017 and 2018, as they maximized their earnings per share performance indicator. These are Merck, Abbot, GSK, AGP, Novartis, Macter, ICI, Highnoon, and Lilly. Sanofi was neither efficient in 2017 nor 2018, as it sought to maximize its earnings per share performance.
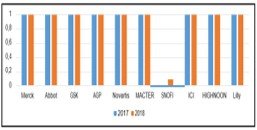
Figure 3
Dividend per Share Efficiency among Ten Manufacturing Firms
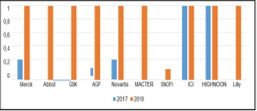
Results from Figure 1.3 show that only ICIC and Highnoon were efficient in 2017 and 2018 when they maximize their dividend per share performance indicator. Merck, Abbot, GSK, AGP, Novartis, Macter, and Lilly all improved their dividend per share maximization efficiency between the 2017-2018 periods; indicating that they improved the performance efficiency to match their inputs to outputs. However, Sanofi was both inefficient in 2017 and 2018, while maximizing its dividend per share.
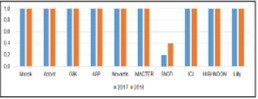
Figure 4
Returns on Equity Efficiency among Ten Manufacturing Firms
Figure 4 shows that nine of the manufacturing firms were just efficient both in 2017 and 2018, as they maximized their earnings per share performance indicator. These are Merck, Abbot, GSK, AGP, Novartis, Macter, ICI, Highnoon, and Lilly. The results also show that Sanofi firm was neither efficient in 2017 nor 2018, as it sought to maximize its returns on equity performance indicators.
Also, in 2018, Merck, Abbot, GSK, AGP, Novartis and Macter, ICI, and Lilly improved on their revenue maximization efficiency; implying that nine of the firms were efficient in 2018 while maximizing their revenue. Table 1.2 reveals that while maximizing earnings per share of shareholders, nine of the firms were efficient both in 2017 and 2018. Along with ICI and Highnoon firms that maintained their efficient operations in 2018, Merck, Abbot, GSK, AGP, Novartis, Macter and Lilly firms improve their efficiency in 2018. Table 1.4 shows that nine of the firms were efficient in maximizing returns on equity in 2017.
Highnoon firm, however, was efficient both in 2017 and 2018, indicating that the firm did not lose its efficient operations while maximizing revenue. Figure 1.2 reveals that nine of the manufacturing firms were just efficient both in 2017 and 2018, as they maximized their earnings per share performance indicator. Sanofi was neither efficient in 2017 nor 2018, as it sought to maximize its earnings per share performance. Results from Figure 1.3 show that only ICI and Highnoon were efficient in 2017 and 2018 when they maximize their dividend per share performance indicator.
Merck, Abbot, GSK, AGP, Novartis, Macter, and Lilly all improved their dividend per share maximization efficiency between the 2017-2018 periods; indicating that they improved the performance efficiency to match their inputs to outputs.
Conclusion
The efficiency of pharmaceutical companies has been measured by STATA measurements that are accurate enough to be trusted. This study is especially useful because the research area of the pharmaceutical industry is not very wide. There is no previous research on the pharmaceutical industry’s efficiency in Pakistan. Thus, this study will help find out which company is more efficient than the other.
In Table 1, total assets, liabilities, equity, taxation, Salaries, wages, and other benefits are taken as inputs and revenues of firms as output. The results show that only one company was very efficient while increasing revenues as output in 2017 and 2018. Highnoon maintained its efficiency in maximizing revenue in 2018, which demonstrates the company's management commitment to the effective use of resources. Also, Merck, Abbots, GlaxoSmithKline, AGP, Novartis, Macter, ICI, and Eli Lilly improved their efficiency while maximizing revenues. This means that 9 of them have maintained high efficiency in 2018.
In Table 2, the same inputs have been taken but change the output. In this analysis, we take earnings per share as output. So, the results show that nine companies were efficient in 2017 and 2018 while maximizing shareholder earnings per share as output. These companies are Merck, Abbott, GlaxoSmithKline, AGP, Novartis, Maxit, ICI, Highnoon, and Eli Lilly. But Sanofi has been inefficient for the past two years.
In Table 3, we have the same inputs but the dividend per share is considered as output. The results show that ICI and Highnoon were efficient in 2017 while trying to maximize their dividends per share as output. Eight companies were not efficient in 2017 these are Abbot, Merck, GSK, AGP, Novartis, Eily Lilly, Sanofi, and Macter while maximizing dividends per share in 2017. In 2018 only Sanofi was not efficient because its inputs did not generate maximum output.
In Table 4, inputs are total assets, liabilities, equity, salaries, and wages. We took return on equity as output. The results show that nine companies achieved the maximum return on equity in 2017. These companies are Merck, Abbott, GSK, AGP, Novartis, Macter, ICI, Highnoon, and Lilly. Similarly, these nine companies have maintained effective operations while maximizing their return on equity. Sanofi was not efficient in both results.
Figure 1 presents a graphical illustration of the efficiency of the firms in trying to maximize the revenue during periods of 2017 and 2018. These firms had poor revenue maximization that was lower than 50% in 2017, which was improved to 100% in 2018. Highnoon was efficient both in 2017 and 2018, indicating that the firm did not lose its efficient operations while maximizing revenue.
Figure 2 reveals that nine pharmaceutical companies were efficient both in 2017 and 2018 because these companies improved by 100% maximization of their earnings per share. In this figure, we can see that Sanofi was not maximizing its earnings per share.
Results from Figure 3 show that only ICI and Highnoon were efficient in 2017 and 2018 when they maximize their dividend per share performance indicator. However, Sanofi was both inefficient in 2017 and 2018, while maximizing its dividend per share. Figure 1.4 shows that nine of the manufacturing firms were just efficient both in 2017 and 2018, as they maximized their earnings per share performance indicator. These are Merck, Abbot, GSK, AGP, Novartis, Macter, ICI, Highnoon, and Lilly.
After reaching the results this study answered the research questions one by one. The first question is about to know the efficiency of pharmaceutical companies in Pakistan. Therefore, 10 pharmaceutical companies have taken in this study and have found the efficiency of pharmaceuticals companies in which 9 out of 10 companies are the most efficient. But only Sanofi does not meet the efficiency parameters. The efficient pharmaceutical companies are Merck, Abbot, Highnoon, Glaxo Kilven Smith, ICI, AGP, Lilly Lilly, Novartis, Macter, and Merck but Sanofi was inefficient because its inputs failed to maximize outputs. Pakistan's pharmaceutical industry is growing exceptionally. There is competition in the pharmaceutical market. The main
segments of pharmaceuticals are Oncology, Cardiometabolic, Neuro, and nutrition. Novartis has its place in oncology. Novartis is the leader of the oncology segment and generates 60% of its revenues from this segment. On the other hand, Abbot, Macter, G.S.K, and AGP compete in the Cardiometabolic and nutrition segment and generates their maximum revenues from these segments. So, Sanofi takes time to create a place in the pharmaceutical market of Pakistan because Sanofi was founded in 2004. Hope it will maximize its revenues quickly in the future. If Sanofi will be able to maximize its revenues then it will also maximize its earnings per share, dividends per share, and return on investments automatically. Through maximizing the revenues Sanofi will turn from inefficient to efficient.
The second question that comes the way is how the pharmaceutical companies come out to be more efficient than the others and how this affects their performance. The answer to this question is quite simple. Companies that utilize their resources in a way closer to the ideal way get to have more efficiency. However, the companies that have lesser inputs or poorer ways to use their inputs to not get the maximum output are said to be less efficient in their production and development. From the companies that have been taken in this study, one, i.e. Sanofi, has come out to be lesser efficient in production than the others. It shows that it does not fulfil the requirements of the efficiency parameters. Sanofi still has the chance to become better and recognize its gaps. The proper procedures for filling out the gaps for taking ideal output will be explained in the suggestions section.
Future Recommendations & Limitations
The government should imply policies to increase the prices that are suitable for the budget of the country. Increasing prices does not mean taking a sudden bump, but providing the pharmaceutical industry with more revenue so that the industry has a further incentive of working efficiently in this area. Another step that can be taken is to provide the pharmaceutical industry with more potential funding so that the research area can be developed. When the research side of the industry is developed, there are more chances of finding a cure to a newly found disease in 6 months rather than 3-6 years when a lot of people die of that certain disease.
The data of pharmaceutical firms was limited, so this study has taken 10 firms for examination for the years 2017 and 2018. The collection of the qualitative primary research was very difficult to conduct. We focused on the pharmaceutical companies of Pakistan to conduct this research. The data was limited because most pharmaceutical companies did not provide the data.
Implications
It is a hard challenge to dynamically reconfigure pharmaceutical companies’ performance. The study will help the pharmaceutical industries in recognizing their positions in the global as well as national markets. The study also implicates how pharmaceutical companies can increase their revenues and how can they improve themselves by the trending goals. It also helps out companies in figuring out ways to increase their efficiencies. This increase in efficiency will make the entire industry better off. It will also increase the GDP of the country and the industry will be providing the country with more revenue. The efficiency can be increased by maximizing the output with the available resources. The ways to do so have also been mentioned in this study.
References
- Acemoglu, D., & Johnson, S. (2007). Disease and Development: The Effect of Life Expectancy on Economic Growth. Journal of Political Economy, 115(6), 925–985. https://doi.org/10.1086/529000
- Akhtar, G. J. I. J. o. H., and Science, S. (2013). Indian pharmaceutical industry: an overview [B].
- Barro, R. J. J. A. o. e., and finance. (2013). Health and economic growth [J]. Annals of Economics and Finance, 14(2): 329-366.
- Blake, H. (2013). A history of… Eli Lilly and Co. https://pharmaphorum.com/views-and-analysis/a-history-of-eli-lilly-co
- Blanc, L. (2015). The European Pharmaceutical Industry in a Global Economy: what drives EU exports of pharmaceuticals? [B] (Vol. 31): College of Europe Bruges, Belgium.
- Bloom, D. E., Canning, D., & Sevilla, J. (2004). The Effect of Health on Economic Growth: A Production Function Approach. World Development, 32(1), 1–13. https://doi.org/10.1016/j.worlddev.2003.07.002
- Board, P. S. A. S. (1992). Definition and recognition of the elements of financial statements: Australian Accounting Research Foundation [B]
- Cosmina Lelia Voinea, & Van, H. L. (2017). Non- market strategic management. London Routledge
- Cung, N. H. J. A. i. S. S. R. J. (2020). Determinants of Tax Burden in Vietnam [J]. World Economic, 7(6), 12-28
- DANZON, P. M. (1997). Price Discrimination for Pharmaceuticals: Welfare Effects in the US and the EU. International Journal of the Economics of Business, 4(3), 301–322. https://doi.org/10.1080/758523212
- Danzon, P. M., & Chao, L.-W. (2000). Cross-national price differences for pharmaceuticals: how large, and why? Journal of Health Economics, 19(2), 159–195. https://doi.org/10.1016/s0167-6296(99)00039-9
- Danzon, P. M., Mulcahy, A. W., & Towse, A. K. (2013). Pharmaceutical Pricing in Emerging Markets: Effects of Income, Competition, and Procurement. Health Economics, 24(2), 238– 252. https://doi.org/10.1002/hec.3013
- DÃaz, R. F., and Sanchez-Robles, B. J. M. (2020). Non-Parametric Analysis of Efficiency: An Application to the Pharmaceutical Industry [J].Quantitative Methods of Economics and Finance, 8(9), 1522-1549
- Duxbury, P., and Tuck, E. J. N. M. I. P. (2008). Pharmaceutical patents need a new lease of life [B]. 42
- Haq, S. (2014). Industry woes: Drug shortage feared as consignments stuck at ports. https://tribune.com.pk/story/769399/industry-woes-drug-shortage-feared-as-consignments-stuck-at-ports
- Hayat, D. K. (2012). Merck Pharmaceuticals (Private) Limited [OL]. https://medimoon.com/2012/09/merck-pharmaceuticals-private-limited
- Hess, A. M., & Rothaermel, F. T. (2011). When are assets complementary? star scientists, strategic alliances, and innovation in the pharmaceutical industry. Strategic Management Journal, 32(8), 895–909. https://doi.org/10.1002/smj.916
- Hickson, K. J. R. o. I., and Wealth. (2014). The GDP Value of Twentieth-Century Health Improvements in Developed Economies: Initial Estimates for England [B]. 60(2): 385- 399.
- Junaidi, I. (2015). No law to stop pharma companies from importing raw materials [OL]. Retrieved from https://www.dawn.com/news/1195030
- Bharathi Kamath, G. (2008). Intellectual capital and corporate performance in Indian pharmaceutical industry. Journal of Intellectual Capital, 9(4), 684–704. https://doi.org/10.1108/14691930810913221
- Khan, N. (2016). Pharmaceutical industry of Pakistan. https://www.slideshare.net/NaushiiKhan/pharmaceutical-industry-of-pakistan
- Kirim, A. S. (1985). Reconsidering patents and economic development: A case study of the Turkish pharmaceutical industry. World Development, 13(2), 219–236. https://doi.org/10.1016/0305-750x(85)90006-3
- Kumah, A. J. I. J. o. C. I. R. (2017). Minimum wage compliance in developing countries among the informal sector workers in Ghana [B]. 3(04),
- Langley, P. C. (1996). The November 1995 Revised Australian Guidelines for the Economic Evaluation of Pharmaceuticals. PharmacoEconomics, 9(4), 341–352. https://doi.org/10.2165/00019053-199609040-00007
- Lee, J.-Y., & Hunt, P. (2012). Human Rights Responsibilities of Pharmaceutical Companies in Relation to Access to Medicines. The Journal of Law, Medicine & Ethics, 40(2), 220–233. https://doi.org/10.1111/j.1748-720x.2012.00660.x
- Leeflang, R. L. I., Klein-Hesselink, D. J., & Spruit, I. P. (1992). Health effects of unemployment—I. Long-term unemployed men in a rural and an urban setting. Social Science & Medicine, 34(4), 341–350. https://doi.org/10.1016/0277-9536(92)90294-z
- Greve, J. (2008). Healthcare in developing countries and the role of business: a global governance framework to enhance the accountability of pharmaceutical companies. Corporate Governance: The International Journal of Business in Society, 8(4), 490–505. https://doi.org/10.1108/14720700810899220
- Madrid, Y., Velásquez, G., and Fefer, E. J. R. P. d. S. P. (1998). The economics of pharmaceuticals and health sector reform in the Americas [B]. 3, 343-350.
- Majumdar, S., & Asgari, B. (2017). Performance Analysis of Listed Companies in the UAE-Using DEA Malmquist Index Approach. American Journal of Operations Research, 07(02), 133– 151. https://doi.org/10.4236/ajor.2017.72010
- Mubarik, S., Chandran, V., & Devadason, E. S. (2016). Relational capital quality and client loyalty: firm-level evidence from pharmaceuticals, Pakistan. The Learning Organization, 23(1), 43–60. https://doi.org/10.1108/tlo-05-2015-0030
- MURATOÄžLU, G. J. J. o. Y. U. (2017). Does pharmaceutical industry boost economic growth? A Competitiveness-related approach [J]. Journal of Economic Development, 12(48), 296- 314
- MURATOÄžLU, G., MURATOÄžLU, Y. J. J. o. E., and Economy, P. (2016). Determinants of export competitiveness: evidence from OECD manufacturing [J]. Journal of Economics and Political Economy, 3(1), 111-118.
- Nath, S. D., Islam, S., & Saha, A. K. (2015). Corporate Board Structure and Firm Performance: The Context of Pharmaceutical Industry in Bangladesh. International Journal of Economics and Finance, 7(7). https://doi.org/10.5539/ijef.v7n7p106
- Ofoegbu, G. N., and Onodugo, V. A. (2016). Liquidity management and profit performance of pharmaceutical manufacturing firms listed in Nigeria Stock Exchange. [J] International Journal of Management Sciences and Business Research, 28(7): 141-162.Pakistan's PharmaceuticalIndustr https://primeinstitute.org/author/mohsin/
- Mardani, A., Zavadskas, E. K., Streimikiene, D., Jusoh, A., & Khoshnoudi, M. (2017). A comprehensive review of data envelopment analysis (DEA) approach in energy efficiency. Renewable and Sustainable Energy Reviews, 70, 1298–1322. https://doi.org/10.1016/j.rser.2016.12.030
- Shewell, P., & Migiro, S. (2016). Data envelopment analysis in performance measurement: a critical analysis of the literature. Problems and Perspectives in Management, 14(3), 705–713. https://doi.org/10.21511/ppm.14(3-3).2016.14
- Shin, K., Lee, D., Shin, K., & Kim, E. (2018). Measuring the Efficiency of U.S. Pharmaceutical Companies Based on Open Innovation Types. Journal of Open Innovation: Technology, Market, and Complexity, 4(3), 34. https://doi.org/10.3390/joitmc4030034
- Urias, E. (2017). The contribution of the Pharmaceutical Industry to the health status of the developing world. International Business and Management, 41–67. https://doi.org/10.1108/s1876-066x20170000033003
- Graf von der Schulenburg, J.-M., & Hoffmann, C. (2000). Review of European guidelines for economic evaluation of medical technologies and pharmaceuticals. HEPAC Health Economics in Prevention and Care, 1(1), 2–8. https://doi.org/10.1007/s101980050002
- Weinstei n, M. C., Siegel, J. E., Gold, M. R., Kamlet, M. S., & Russell, L. B. J. J. (1996). Recommendations of the Panel on Cost- effectiveness in Health and Medicine [J]. JAMA, 276(15), 1253-1258.
- Yesyurun, P. J. E. J. o. M. (2021). The Determinants Factor of Dividend Payout Ratio: an Empirical Study of Bank Buku IV in Indonesia . Journal of Management Sciences, 11(2),218-224. https://doi.org/10.35335/enrichment.v11i2.71
Cite this article
-
APA : Tariq, M. G., Ziaullah, M., & Hayyat, A. (2023). Efficiency Assessment and Strategic Insights for Enhancing Pharmaceutical Industry Performance in Pakistan: A Data Envelopment Analysis Approach. Global Pharmaceutical Sciences Review, VIII(I), 78-91. https://doi.org/10.31703/gpsr.2023(VIII-I).12
-
CHICAGO : Tariq, Muhammad Gulraiz, Muhammad Ziaullah, and Asghar Hayyat. 2023. "Efficiency Assessment and Strategic Insights for Enhancing Pharmaceutical Industry Performance in Pakistan: A Data Envelopment Analysis Approach." Global Pharmaceutical Sciences Review, VIII (I): 78-91 doi: 10.31703/gpsr.2023(VIII-I).12
-
HARVARD : TARIQ, M. G., ZIAULLAH, M. & HAYYAT, A. 2023. Efficiency Assessment and Strategic Insights for Enhancing Pharmaceutical Industry Performance in Pakistan: A Data Envelopment Analysis Approach. Global Pharmaceutical Sciences Review, VIII, 78-91.
-
MHRA : Tariq, Muhammad Gulraiz, Muhammad Ziaullah, and Asghar Hayyat. 2023. "Efficiency Assessment and Strategic Insights for Enhancing Pharmaceutical Industry Performance in Pakistan: A Data Envelopment Analysis Approach." Global Pharmaceutical Sciences Review, VIII: 78-91
-
MLA : Tariq, Muhammad Gulraiz, Muhammad Ziaullah, and Asghar Hayyat. "Efficiency Assessment and Strategic Insights for Enhancing Pharmaceutical Industry Performance in Pakistan: A Data Envelopment Analysis Approach." Global Pharmaceutical Sciences Review, VIII.I (2023): 78-91 Print.
-
OXFORD : Tariq, Muhammad Gulraiz, Ziaullah, Muhammad, and Hayyat, Asghar (2023), "Efficiency Assessment and Strategic Insights for Enhancing Pharmaceutical Industry Performance in Pakistan: A Data Envelopment Analysis Approach", Global Pharmaceutical Sciences Review, VIII (I), 78-91
-
TURABIAN : Tariq, Muhammad Gulraiz, Muhammad Ziaullah, and Asghar Hayyat. "Efficiency Assessment and Strategic Insights for Enhancing Pharmaceutical Industry Performance in Pakistan: A Data Envelopment Analysis Approach." Global Pharmaceutical Sciences Review VIII, no. I (2023): 78-91. https://doi.org/10.31703/gpsr.2023(VIII-I).12