Abstrict
Biological half-life and volume of distribution of the drug are the key parameters in understanding the pharmacokinetics of the drugs within the body as they affect all the pharmacokinetic processes including absorption, distribution, metabolism and elimination of drugs and also associated with each other, ultimately effecting the Pharmacological action of the drug on its target site. Given study elaborates the various aspects of half-life, i.e., Alpha & beta half-lives, the contribution of Zero-order and first-order kinetics in ADME and interrelation among the volume of distribution & half-life along with the distribution & redistribution of the drug within the body. Moreover, the importance of half-life & Vd and the idea of Steady-state concentration is also discussed. Various types of physiological barriers, including the blood-brain barrier, placental barrier, blood-CSF barrier, affect the distribution of drugs.
Keywords
Half-Life, Clearance, Volume, Distribution, Binding
Introduction
Biological half-life, i.e., the time taken by the drug concentration to decline to one half of its original value, is dependent upon various factors; one of the significant factors is the volume of distribution. Both collectively affect the rate of absorption, distribution, metabolism, and elimination of the drug from the body. It helps to understand the nature of the zero-order and first-order processes as to how the drug will follow linear or nonlinear kinetics during its stay in various compartments of the body. Moreover, the number & amount of enzymes involved in these processes vary from person to person on a genetic basis, which is responsible for the change of the predicted rates affecting bioavailability of the drug is also affected by the plasma and tissue binding of the drugs. Complete data on these parameters can help one choose the optimized dose and dosing schedule of a specific drug for the individualized patients to achieve the optimized effect.
Half-life
Time required by the drug concentration to fall to one half of its initial value is termed as Half-life. Moreover, the natural cleansing of substances and their excretion via the liver in the body measured by the Kidneys and the intestines is called Biological Half-life(Leon Shargel).
In terms of medical literature, Half-life is vividly describing the time that is taken by the plasma concentration of the drug substance to become half during the circulation in the blood going through various organs of the body(Smith, Beaumont, Maurer, & Di, 2018). Measurement of half-life is useful in Pharmaceuticals and medicines because it actually determines how much drug is needed and what should be the frequency of the drug if a particular dose of the drug is consistently needed. On the other hand, the plasma stability of a drug that is essential for the accuracy of drug analysis and detection of a substance in plasma is reliant on the half-life of the drug in plasma(D. J. Greenblatt, 1985).
Various factors, including the protein binding, tissue accumulation & receptor interactions, the interrelation between the plasma half-life and biological half-life of a drug, is a bit complicated. By experimentally measuring the time that is required to eliminate the plasma drug(D J Greenblatt, 1985).
![]()
Importance of elimination Rate Constant
A drug that is following first-order kinetics is usually expected to be eliminated to a certain degree after administration that is usually expressed as a rate of the fraction cleared per unit time, e.g. per hour (1/hr) is actually the elimination constant that indicates the 10 percent removal of drug per hour. When it is plotted on the semi-logarithmic scale, then the plasma concentration vs time curve obtained is linear, which signifies that the concentration reducing at a linear rate that is predictable(Mahmood, 2017).
![]()
The amount (fraction) of the drug removed per unit of time from the body is called the elimination rate constant.
The concentration of a drug can be detected at any time by the following formula
![]()
Importance of Volume of Distribution in the determination of Half-life
Various substances are eliminated when a certain plasma volume moves through a suitable organ of filtration, which in turn filters the substance from the plasma circulation and pass the drug to some filtrate, e.g. urine, bile, dialysate, or gas that is exhaled. Clearly, the amount of drug that is present in that specific volume of plasma is the main factor in elimination via these organs because if the drug is accumulated in the tissues or to proteins in plasma, then the clearance will be decreased because there is less drug concentration in plasma. This is called the Volume of Distribution(Smith, Beaumont, Maurer, & Di, 2015).
![]()
Hence the overall equation becomes
![]()
This equation explains the overall calculation of half-life. The volume of distribution sometimes changed by pathological conditions of the body can change of elimination of some drug substances. For example, the Overload of the fluid in case of Kidney failure increases the Vd, and as a result, the rate of the clearance tends to be decreased, as only a small amount of the drug becomes available for clearance, and half-life may end up exactly the same. (Gibaldi & Levy, 1976).
Generally, Peak plasma concentration is used to estimate the time that is required for the drug to fall to 50 per cent of its initial value.
Elimination of Drug
Usually, a drug substance will be removed after a total of 6 half-lives.
After 1st half-life, the concentration will be 50%.
Then after 2nd half-life, %age eliminated will be 25%.
Then after 3rd half-lives, %age eliminated will be 12.5%.
Then after the 4th half-lives, the %age eliminated will be 6.25%.
Then after 5th half-lives, %age eliminated will be 3.125%.
Then after the 6th half-lives, the %age eliminated will be 1.56%.
6.25% is very far below the threshold to produce pharmacological action. That’s why the drugs usually show no pharmacological effect after the completion of 4 half-lives after the administration or said so.
Steady State
Plateau or constant serum drug level is that level at which the amount of drug that is eliminated is equal to the amount of drug that is administered within one dosing interval.
Drug Substances are having a short half-life reach a steady state quickly, while drug substances are having longer half-life take a large time to reach the plateau state(Berezhkovskiy, 2013).
A plateau state occurs after a drug is given for approximately five elimination half-lives. In plateau state, the rate of drug administration becomes equal to the rate of drug elimination and plasma concentration-time curves found after each dosing should be almost superimposable.
The rate in = rate out
Linear kinetics achieved in 4 or 5 half-lives.
Helps interpreting drug substance concentration and evaluating medical responses in a timely manner.
Importance of Half-life
Half-life helps in the measurement of
Duration of pharmacological Action after administration of a single dose
The time needed to reach plateau state
Dose administration Frequency
Determination of Dosing Schedule
It is important in the case of infusion systems to determine the time between the intervals.
Determination of time to drug elimination
This comes with the impression of figuring out the time required to eliminate drugs.
Therapeutic Drug Monitoring
![]()
This is a determination of the substance the safety of the drug within the body. A bigger number signifies a large margin of Safety of drug and vice versa(D. J. Greenblatt, 1985).
Zero and first-order kinetics
Zero Order kinetic
Metabolism of a rug occurs at a continuous rate in the case when the amount of the enzyme is very limited that is required to metabolize the drug. Hence as a result of this enzyme becomes saturated with the drug. This phenomenon is termed Zero Order Dynamics(Riad, Chan, Wagner, & Sawchuk, 1986).
So by increasing the concentration of the reactants, even to double, do not result in the increase of the rate of reaction; hence the rise is zero, also called Zero-order dynamics. Plasma concentration vs reaction rate curve becomes a straight line in this case(Riad et al., 1986).
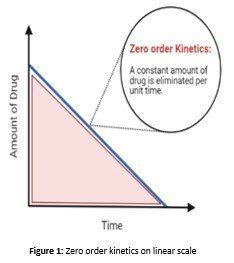
Graphical Representation
It's seen as a line on the graph in zero-order dynamics; increasing the concentration of a drug higher than a precise purpose doesn't increase the speed of metabolism. The simplest far-famed example of zero-order dynamics is alcohol. There are not any notable samples of the therapeutic medication that have saturable metabolism and zero-order dynamics(Yang & Fassihi, 1996). However, some therapeutic medication taken in excess will have saturable dynamics, e.g. the anti-epileptic drug Phenytoin.
First Order Dynamics
In case when the excess amount of the enzymes is available for the metabolism, then the drug concentration levels fall rapidly as they are readily metabolized. The amount of the enzyme or the accelerator is present in excess. Therefore, the enzyme is unsaturated with the drug. This is called First order dynamics(Srividhya & Schnell, 2006). In such a case by increasing the amount of the drug will also increase the rate of metabolism of the drug because the 1st order dynamics is actually associated with the drug that square is the measure of the unchanged drug eliminated.
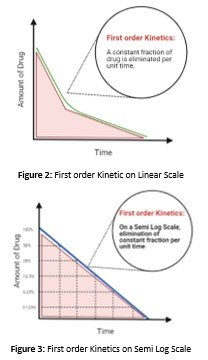
Graphical Representation
First Order dynamics on a linear scale
Enzymes and clearance mechanisms square
measure acting at well below their most capability, and drug concentration increase shows an increase in the rate of elimination, indicating a direct relation between them.
First Order dynamics of elimination on Semi-log scale
The drug concentration halves predictably in step with fastened time intervals on a semi-logarithmic scale, the concentration and time curve are linear.
Clinical Implications of First and Zero order kinetics
1st order dynamics square measure is thought of as a linear method that occurs as a result of the elimination rate being directly proportional to the drug concentration. This states that the larger the concentration of the drug greater will be the elimination rate. In other words, the process does not become saturated and inhibits the accumulation of the drug form the body(Wang, Qin, & Witarsa, 2018). 1st order elimination dynamics are responsible for the elimination of 95 percent of the medication that is used therapeutically. Whereas some substances accumulate due to the limited elimination because of the saturation of the process. for example, square measure phenytoin, cisplatin, omeprazole. After the point of saturation, the elimination does not depend on the drug concentration. We can also say that is nonlinear kinetics.
Volume of Distribution
Definition
Volume of distribution is actually a dilution space that is the fluid volume that is required to contain a certain amount of the drug present inside the body at exactly the same concentration as is present within the plasma(Smith et al., 2015). Volume of distribution is also called apparent volume of distribution and it is not a physical space rather it is a dilution space.
It is measured as the dose or the quantity of the drug present within the body divided by the plasma concentration of the drug after the equilibrium among the tissues and plasma has been established(Wesolowski, Wesolowski, Babyn, & Wanasundara, 2016). Similarly the drug tends to accumulate in the tissues such as in the fat tissue in that case the volume of distribution is high and the plasma concentration of the drug is low (Nielsen & Rasmussen,1977).
Criteria
Drug substances having a low Vd that is less than 10L remain confined to the IV fluid hence in the blood. There can be 2 reasons for that
1- The size of the molecule may be large enough to avoid the movement away from the compartment.
2- There may be plasma protein binding of the drug substance, e.g., with albumin or globulin, and less tissue binding.
There is also a competition among the exogenous and endogenous molecules for the plasma protein binding sites.
Less lipid solubility can be a reason that some drugs cannot enter the other compartments. Such drugs have low Vd that is 12 to 20 L, and get distributed among the body water in the extracellular compartment. Drugs having large Vd tends to accumulate in the tissues by active transport or due to specific binding to tissues, and sometimes the Vd can even be greater than anatomical body volume. Hence Vd is not specific to anatomical compartments(Rowland, Benet, & Graham, 1973). Fats store lipid-soluble drugs. Similarly, bone can store some drugs, too, like tetracycline and heavy metal.
Formula
![]()
Where C is the Plasma concentration and A is Area under the curve
Most significantly, the Vd measures the circumstances under which the distribution of drug among the plasma and tissues will be at equilibrium.
Applications
Loading dose can be estimated.
Clearance are often calculated.
Total quantity of drug present within the body are often determined.
Factors effecting Vd
Extra cellular Fluid-In children ECF is large, thus Vd is increased therefore dose adjustments are necessary.
Tissue perfusion – decreased perfusion implies decreased Vd
Plasma protein binding- High plasma protein binding decreases Vd.
Water Soluble drugs have low Vd.
Lipid soluble drugs have high.
Low molecular mass drugs have high Vd.
Steady-State volume of Distribution
At a steady state, the volume of distribution (Vss) in plasma indicates the equivalent volume of the plasma in which the drug is apparently distributed into the body at the given doses(Berezhkovskiy, 2013).
Relation between Vd and Half-life
![]()
Drug distribution
Drug distribution literally means that the movement of the drug substances into the blood and from blood to the various tissues and organs of the body and back to the blood and hence measures the relative amounts of drugs inside the various tissues(Teboul & Chouinard, 1990). When the drug enters the blood after absorption, it then immediately moves through the body.
Passive diffusion is a process that is mainly involved.
Role of distribution
The onset of action, the intensity of action and duration of action are significantly affected by the Drug Distribution.
Different compartments of the body
ICF and ECF are the main fluid compartments within the body that the water occupies. ICF is the intracellular fluid means the water present within the cells, whereas the ECF is the extracellular fluid that is the water present outside the cells.
Composition of body fluid
Non-electrolytes do not dissociate in the solution because of the strong bonds. Hence no ions or any other charged specie is created in water that can be dissolved. Mostly these compounds are organic compounds for example, urea, lipids, and Creatinine. On the contrary, electrolytes do give ions after dissociating in water, which is charged and helps in the conduction of electric current too. Examples include acids, bases, and organic salts. Hence as a result of this, electrolytes overall have a large osmotic power than the non-electrolytes. Water always moves from an area of high-water potential to an area of large osmolarity following osmotic gradients irrespective of the type of substances present within it. That's why the electrolytes cause fluid shifts.
Fluid Movement among Compartments
Body fluids combination as well as continual exchange are regulated by the hydrostatic and osmotic pressures. As osmotic gradient among the compartments is responsible for the free movement of the water, hence the solutes may be electrolytes and non-electrolytes show unequal distribution due to their electrical charge, size, and dependence on transport proteins.
1-Across the capillary walls exchange occurs between plasma and intestinal fluid.
2-Exchange among the intracellular and interstitial fluid occurs across the plasma membranes.
3-ECF and ICF volumes are changed by many factors.
Osmolarities of different fluids of the body are equal due to the free movement of the water among the compartments. Water moves out of the cells due to the change in the volume and osmotic pressure of the Intracellular fluid due to an increase in the ECF content. Similarly, water moves into the cells due to the decrease in the osmolarity of the fluid. It can be concluded that Intracellular fluid volume depends upon the concentration of the ECF.
Steps in Distribution
Free drug permeates through the capillary wall and enters the body fluids Then these drugs permeate through the ECF to the ICF passing the membrane of the tissue cell. This is called the diffusion of the drug and continues to occur until the equilibrium is established. Drug distribution can even be passive if the concentration gradient between the blood and extravascular tissues is the driving force(Grover & Benet, 2009). As different tissue receive the drug at different rates from the plasma and hence get the different extent of the drug, so the distribution is not uniform throughout the body.
Permeability of the drugs through the tissues depends upon the physicochemical properties of the drug, such as the pKa, molecule size, physicochemical barriers & lipid water partition coefficient.
Size of the tissue or organ and rate of perfusion.
Drug binding is binding to blood proteins or to extracellular elements.
Redistribution half-life
Redistribution half-life, also known as Alpha half life is the measure of the decrease in the concentration of the drug to 50 percent of its original value due to the redistribution of the drug, whereas the beta half-life is the rate of the decline in the plasma concentration of the drug due to the elimnation via the metabolism of the drug.
Special Compartments for Drug Distribution and Physiological Barriers to Drug Distribution Drug Distribution
Drug distribution signifies the distribution of drug substances between the blood and numerous tissues and organs of the body, e.g. fats, brain tissue, and muscle tissue. After the absorption of the drug from the intestine, it circulates rapidly through the body.
Factors Affecting Drug Distribution
• Tissue binding.
• Blood perfusion.
• Regional pH.
Special Compartments
Cellular Reservoir
• Drug substances having affinity to tissue proteins
• Chloroquine to the liver, retina.
• Digoxin & emetic drugs to Skeletal muscle, heart, liver, kidney.
Fat as Reservoir
• The drugs which have very high lipid solubility, for example, Accumulation of DDT, Organophosphate compounds & thiopentone in the fatty tissue.
• Starvation - Drug toxicity
Bones and Connective Tissue
• Tetracycline & fluorides get deposited in the bone due to complex formation.
• Accumulation of antifungal drugs in fingernails and skin.
Protein Binding in Plasma acting as a Drug Reservoir
• Drugs bind in reversible manner with the
plasma and tissue proteins and equilibrium is established(Spreafico & Jacobson, 2013).
• Plasma albumin.
1. Warfarin 2. Penicillin
Physiological Barriers to Drug Distribution
In some tissues a membrane can act as a barrier due to special structural feature and it can be a restriction to the permeability and hence the distribution of drugs.
Types of Physiological Barrier
Capillary Endothelial Barrier
Less than 600 Daltons particle size of drugs leads to the greater permeability of the drugs through the membranes by the passive diffusion.
Cell Membrane Barrier
After passing through the capillary membrane, the drug moves into the ECF & further movement of the drug to the specific tissues is limited due to the membranes.
Blood-Brain Barrier
• This barrier is constituted of the tight intracellular junctions between the endothelial cells present in the capillaries of the brain.
• The absence of fenestrations or slits among the endothelial cells of brain capillaries & Astrocyte processes inhibits the crossing of the membranes hence lipid-soluble substances are the only ones that can pass through the blood-brain barrier.
Diseased Blood Brain Barrier
During the inflammatory conditions of the menengis, blood- brain barrier shows increase permeability and other antibiotics that are polar, like penicillin-G, enters the brain.
Blood-CSF barrier
• The choroid plexus of the fourth, third and lateral ventricles constitute the Cerebrospinal Fluid.
• THE blood CSF barrier is made up of tight junctions joining the Choroid cells together.
Placental barrier
• The placental barrier comprises several layers of tissues made of fetal trophoblast basement membrane and endothelium present between the maternal and fetal blood vessels.
• The placental barrier is not as effective as the blood-brain barrier, and impermeability of the placental barrier to polar compounds is relative rather than absolute.
Conclusion
Physicochemical properties of the drug substances including pKa, drug particle size, molecular weight, octanal water coefficient, along with the physiological properties and pharmacokinetic parameters like tissue & protein binding, affect the distribution of the drug in various compartments of the body leading to the change in the concentration of the drug in the plasma and availability of the active drug on the active site for the pharmacological action, half-life and volume of distribution play an intermediate role changing accordingly giving an understanding of numerous pathways followed by the drug in the body and helps us to modify the dosage form in the most effective way in order to control the pharmacokinetics to get the optimized effect. Half-life determines the frequency and dosing schedule even helps to reach a steady state, which results in the constant effect of the drug. Hence a clear knowledge and control of these parameters can lead to control of the pathway of drug within the body.
References
- Berezhkovskiy, L. M. (2013). Prediction of drug terminal half-life and terminal volume of distribution after intravenous dosing based on drug clearance, steady-state volume of distribution, and physiological parameters of the body. J Pharm Sci, 102(2), 761-771. doi10.1002/jps.23396
- Gibaldi, M., & Levy, G. (1976). Pharmacokinetics in Clinical Practice I. Concepts. JAMA, 235(17), 1864-1867. doi10.1001/jama.1976.03260430034020 J JAMA
- Greenblatt, D. J. (1985). Elimination half-life of drugs value and limitations. Annu Rev Med, 36, 421- 427. doi10.1146/annurev.me.36.020185.002225
- Greenblatt, D. J. (1985). Elimination Half-Life of Drugs Value and Limitations. 36(1), 421-427. doi10.1146/annurev.me.36.020185.002225
- Grover, A., & Benet, L. Z. (2009). Effects of drug transporters on volume of distribution. Aaps j, 11(2), 250-261. doi10.1208/s12248-009-9102- 7
- Leon Shargel, S. W.-P., Andrew B.C. Yu. Applied Biopharmaceutics & Pharmacokinetics (7th ed.) Mc Graw Hill.
- Mahmood, I. (2017). Prediction of Clearance, Volume of distribution, and Half-life of Drugs in Extremely Low to Low Birth Weight Neonates An Allometric Approach. Eur J Drug Metab Pharmacokinet, 42(4), 601-610. doi10.1007/s13318-016-0372-z
- Nielsen, P., & Rasmussen, F. (1977). Half-life, apparent volume of distribution and protein- binding for some sulphonamides in cows. Res Vet Sci, 22(2), 205-208.
- Riad, L. E., Chan, K. K., Wagner, W. E., Jr., & Sawchuk, R. J. (1986). Simultaneous first- and zero-order absorption of carbamazepine tablets in humans. J Pharm Sci, 75(9), 897-900. doi10.1002/jps.2600750916
- Rowland, M., Benet, L. Z., & Graham, G. G. (1973). Clearance concepts in pharmacokinetics. Journal of Pharmacokinetics and Biopharmaceutics, 1(2), 123-136. doi10.1007/BF01059626
- Smith, D. A., Beaumont, K., Maurer, T. S., & Di, L. (2015). Volume of Distribution in Drug Design. J Med Chem, 58(15), 5691-5698. doi10.1021/acs.jmedchem.5b00201
- Smith, D. A., Beaumont, K., Maurer, T. S., & Di, L. (2018). Relevance of Half-Life in Drug Design. J Med Chem, 61(10), 4273-4282. doi10.1021/acs.jmedchem.7b00969
- Spreafico, M., & Jacobson, M. P. (2013). In silico prediction of brain exposure drug free fraction, unbound brain to plasma concentration ratio and equilibrium half-life. Curr Top Med Chem, 13(7), 813-820. doi10.2174/1568026611313070004
- Srividhya, J., & Schnell, S. (2006). Why substrate depletion has apparent first-order kinetics in enzymatic digestion. Comput Biol Chem, 30(3), 209-214. doi10.1016/j.compbiolchem.2006.03.003
- Teboul, E., & Chouinard, G. (1990). A Guide to Benzodiazepine Selection. Part I Pharmacological Aspects*. 35(8), 700-710. doi10.1177/070674379003500811
- Wang, Y., Qin, C., & Witarsa, F. (2018). Clarifying configurations of reaction rate constant for first-order and Monod-type kinetics A comparative manner and a pursuit of parametric definition. Waste Manag, 77, 22-29. doi10.1016/j.wasman.2018.04.040
- Wesolowski, C. A., Wesolowski, M. J., Babyn, P. S., & Wanasundara, S. N. (2016). Time Varying Apparent Volume of Distribution and Drug Half- Lives Following Intravenous Bolus Injections. PLoS One, 11(7), e0158798. doi10.1371/journal.pone.0158798
- Yang, L., & Fassihi, R. (1996). Zero-order release kinetics from a self-correcting floatable asymmetric configuration drug delivery system. J Pharm Sci, 85(2), 170-173. doi10.1021/js950250r
Cite this article
-
APA : Khan, R. M. A., Umair-ul-Hassan., & Shafiq-ur-Rehman. (2018). An Updated Review on Biological Half-Life & Volume of Distribution. Global Pharmaceutical Sciences Review, III(I), 19-26. https://doi.org/10.31703/gpsr.2018(III-I).03
-
CHICAGO : Khan, Rana Muhammad Awais, Umair-ul-Hassan, and Shafiq-ur-Rehman. 2018. "An Updated Review on Biological Half-Life & Volume of Distribution." Global Pharmaceutical Sciences Review, III (I): 19-26 doi: 10.31703/gpsr.2018(III-I).03
-
HARVARD : KHAN, R. M. A., UMAIR-UL-HASSAN. & SHAFIQ-UR-REHMAN. 2018. An Updated Review on Biological Half-Life & Volume of Distribution. Global Pharmaceutical Sciences Review, III, 19-26.
-
MHRA : Khan, Rana Muhammad Awais, Umair-ul-Hassan, and Shafiq-ur-Rehman. 2018. "An Updated Review on Biological Half-Life & Volume of Distribution." Global Pharmaceutical Sciences Review, III: 19-26
-
MLA : Khan, Rana Muhammad Awais, Umair-ul-Hassan, and Shafiq-ur-Rehman. "An Updated Review on Biological Half-Life & Volume of Distribution." Global Pharmaceutical Sciences Review, III.I (2018): 19-26 Print.
-
OXFORD : Khan, Rana Muhammad Awais, Umair-ul-Hassan, , and Shafiq-ur-Rehman, (2018), "An Updated Review on Biological Half-Life & Volume of Distribution", Global Pharmaceutical Sciences Review, III (I), 19-26
-
TURABIAN : Khan, Rana Muhammad Awais, Umair-ul-Hassan, and Shafiq-ur-Rehman. "An Updated Review on Biological Half-Life & Volume of Distribution." Global Pharmaceutical Sciences Review III, no. I (2018): 19-26. https://doi.org/10.31703/gpsr.2018(III-I).03